
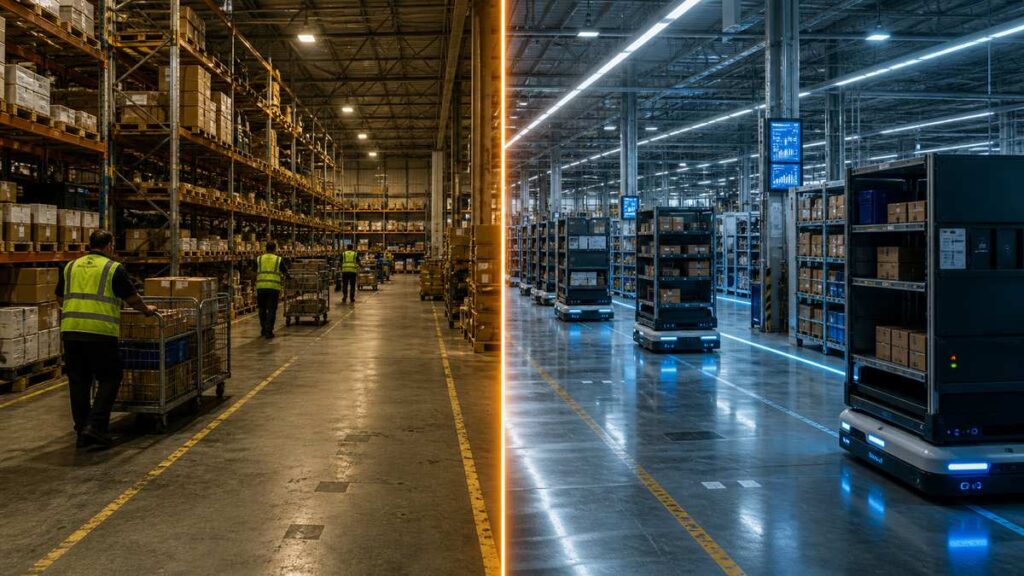
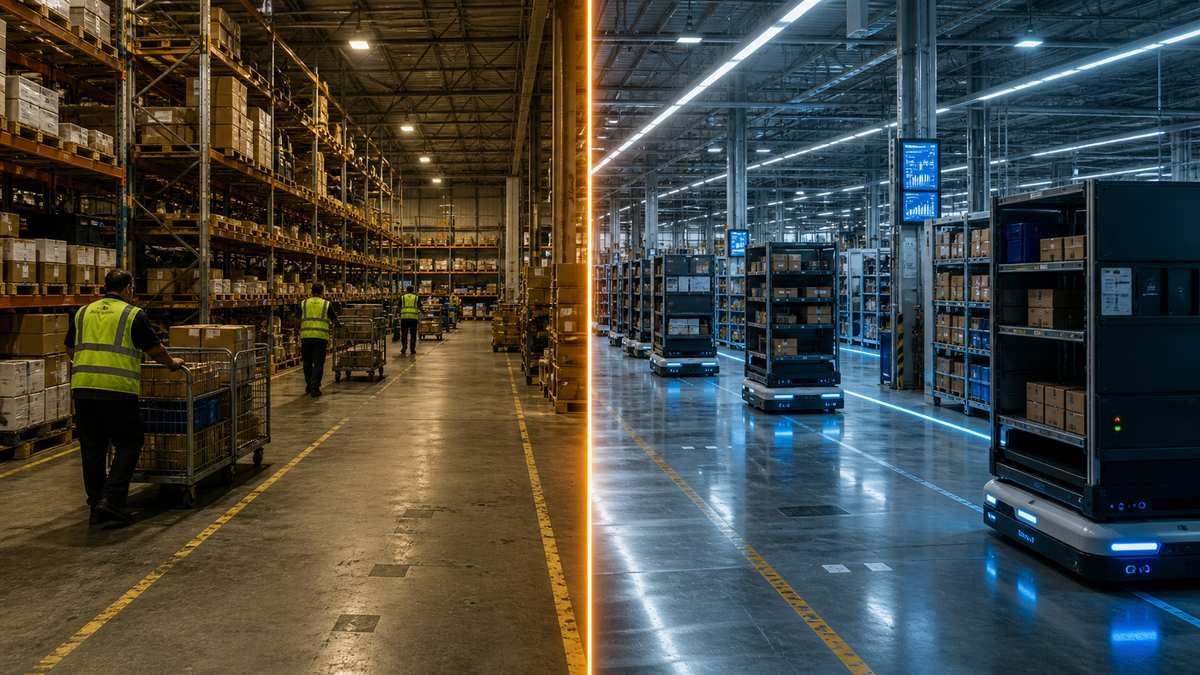
If you are considering warehouse automation, the first question on the table is always the same: what is the warehouse automation ROI, and how long before the investment pays for itself?
It is a fair question. Automation projects can run from $500,000 for a small goods-to-person zone to $20 million or more for a full-scale ASRS deployment. The stakes are high, and the wrong decision can tie up capital for years with little to show for it.
At GoASRS, we have helped over 50 companies across retail, manufacturing, 3PL, and electronics run the numbers before committing. This guide breaks down exactly how to calculate warehouse automation ROI, what real cost structures look like, and where the biggest returns come from — based on projects we have actually delivered.
The Warehouse Automation ROI Formula
Before getting into specifics, here is the core formula:
ROI (%) = (Net Annual Benefits – Annual Costs) / Total Investment x 100
But that single line hides a lot of complexity. To get a number you can trust, you need to break it into three components:
- Total Investment (CAPEX) — equipment, software, integration, site preparation, training
- Annual Operating Costs (OPEX) — maintenance, software licenses, energy, spare parts
- Annual Benefits — labor savings, throughput gains, error reduction, space savings, inventory accuracy
The goal is not just a percentage. What matters is the payback period — the number of years before cumulative benefits exceed total investment. For most warehouse automation projects, that falls between 2.5 and 5 years depending on scale, labor costs, and utilization rates.
Real Cost Breakdown: CAPEX vs. OPEX
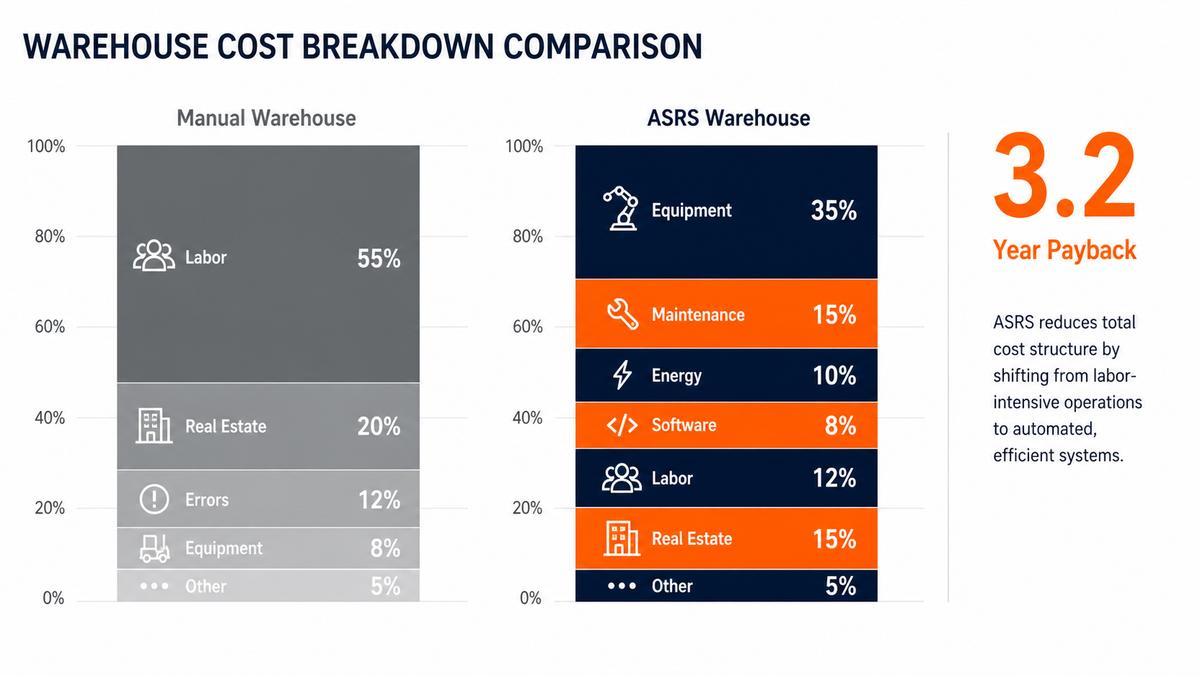
One of the most common mistakes in ROI calculations is underestimating the full cost picture. Here is what a typical ASRS system cost structure looks like:
Capital Expenditure (CAPEX)
| Cost Category | % of Total | Typical Range |
|---|---|---|
| Hardware (racking, robots, conveyors) | 40-50% | $200K – $10M+ |
| Software (WES, WMS integration) | 10-15% | $50K – $500K |
| System Integration | 15-20% | $75K – $1M |
| Site Preparation | 5-10% | $25K – $300K |
| Training & Commissioning | 3-5% | $15K – $100K |
Operating Expenditure (OPEX)
Annual operating costs typically run 5-8% of the initial CAPEX:
- Maintenance contracts: 3-5% of hardware cost per year
- Software licensing: $20K-$80K/year depending on scale
- Energy: automated systems use 30-40% less energy per unit moved than manual operations
- Spare parts inventory: 1-2% of hardware cost
When we deployed a goods-to-person system for a consumer electronics distributor, the total CAPEX came in at $2.8 million. Annual OPEX settled at $185,000 — about 6.6% of the initial investment. That ratio held steady across the first three years of operation.
Labor Savings: The Biggest ROI Driver
Labor is where automation makes the most dramatic impact. In a manual warehouse, labor accounts for 50-70% of total operating costs. Automation does not eliminate all labor, but it fundamentally changes the ratio.
Here is what we typically see across projects:
| Operation | Manual FTEs | Automated FTEs | Reduction |
|---|---|---|---|
| Picking | 30 | 8 | 73% |
| Putaway | 12 | 3 | 75% |
| Replenishment | 8 | 2 | 75% |
| Inventory counting | 6 | 1 | 83% |
| Shipping/sorting | 10 | 6 | 40% |
| Total | 66 | 20 | 70% |
At an average fully-loaded labor cost of $45,000/year per warehouse worker (including benefits, overtime, turnover costs), that 46-person reduction translates to $2.07 million in annual labor savings.
The labor math gets even more compelling when you factor in:
- Turnover costs: The warehouse industry averages 36% annual turnover. Each replacement costs $3,000-$5,000 in recruiting and training. With 66 manual workers, that is $71K-$119K per year just in churn.
- Overtime premiums: Peak season overtime at 1.5x rates can add 15-25% to labor costs for 2-3 months per year.
- Shift expansion: Automated systems run 2-3 shifts without proportional labor increases. A robotic system that runs 20 hours/day needs the same maintenance crew as one running 8 hours.
One of our 3PL clients was spending $3.2 million annually on warehouse labor across two shifts. After deploying a bin robot system with WES integration, their labor cost dropped to $1.1 million — a 66% reduction that alone covered the system cost in under 2 years.
Storage Density and Space Savings
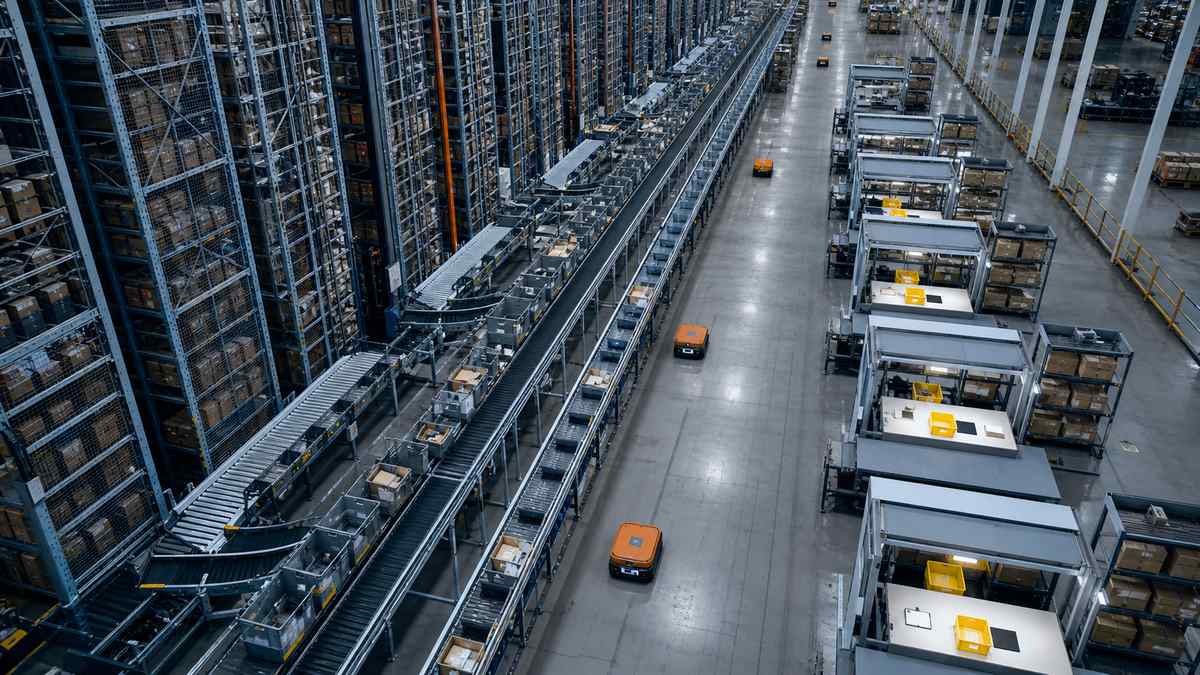
Automated storage systems use vertical space that manual operations cannot reach. A standard manual warehouse uses 25-30% of available cubic space. An ASRS installation pushes that to 60-85%.
The financial impact depends on your real estate situation:
If you are leasing warehouse space:
- Average US warehouse lease: $9.50/sq ft/year (CBRE 2025 data)
- A 100,000 sq ft manual warehouse storing 15,000 SKUs might need only 45,000 sq ft with ASRS
- Annual lease savings: 55,000 sq ft x $9.50 = $522,500/year
If you are avoiding a new facility:
- Building a new warehouse costs $120-$180/sq ft
- If automation lets you stay in your current building instead of expanding, the avoided CAPEX can be $5-15 million
When we worked with a footwear and apparel brand, they were six months away from signing a lease on a second warehouse. After installing a shuttle ASRS in their existing facility, they increased storage capacity by 3.2x and cancelled the expansion plan entirely. The avoided lease alone was worth $480,000 per year.
Error Reduction and Accuracy Gains
Manual picking error rates typically run 1-3% of orders. That sounds small until you calculate the cost per error:
- Return processing: $15-$30 per return
- Reshipping: $8-$15 per order
- Customer service time: $5-$10 per complaint
- Lost customer lifetime value: hard to quantify, but real
A warehouse shipping 5,000 orders/day with a 2% error rate generates 100 errors daily. At $25 average cost per error, that is $912,500 per year in error-related costs.
Automated systems with barcode/RFID verification consistently achieve 99.97%+ accuracy — reducing errors by 90-95%. For the example above, that cuts error costs to under $100,000/year, saving over $800,000 annually.
Inventory accuracy follows the same pattern. Manual cycle counts achieve 95-97% accuracy. Automated systems with real-time tracking maintain 99.5%+ accuracy, which reduces stockout events, overstock carrying costs, emergency expedited shipments, and write-offs from expired or lost inventory.
The Payback Timeline: What Real Projects Look Like
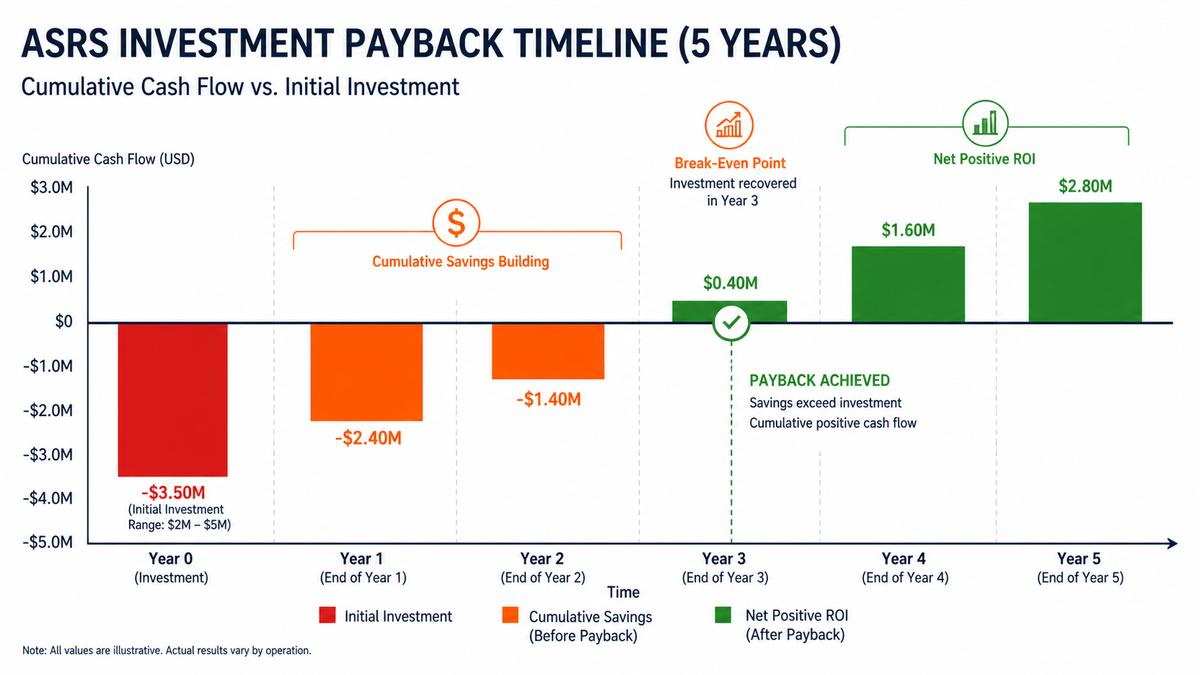
Based on projects we have delivered, here is how the payback timeline typically breaks down:
Year 1: System is installed and ramping up. Benefits start at 40-60% of full capacity as staff adapts and processes stabilize. Net cash flow is still negative.
Year 2: Full operational speed. Labor savings, accuracy gains, and throughput improvements hit their stride. Most projects cross the break-even point late in Year 2 or early Year 3.
Year 3: Cumulative benefits exceed total investment for well-planned projects. The system is generating positive ROI.
Years 4-5: Pure return territory. With OPEX at 5-8% of CAPEX annually, the net benefit compounds. Many clients use this period to fund Phase 2 expansions.
Years 6-10: Equipment lifecycle continues with periodic upgrades. Software updates keep the system current. Total ROI over 10 years typically reaches 200-400%.
Here is a concrete example from a manufacturing client:
| Metric | Value |
|---|---|
| Total Investment | $3.5M |
| Annual Labor Savings | $1.4M |
| Annual Space Savings | $280K |
| Annual Error Reduction | $120K |
| Annual OPEX | -$230K |
| Net Annual Benefit | $1.57M |
| Payback Period | 2.2 years |
| 5-Year ROI | 324% |
Warehouse Automation ROI by Industry
ROI varies significantly by industry because labor intensity, order profiles, and accuracy requirements differ. Here is what we see across our client base:
E-commerce and Retail
- Payback period: 2-3 years
- Primary ROI driver: Labor savings during peak seasons (Black Friday, holiday)
- Typical ROI at 5 years: 250-350%
- Key factor: High order volume with small, variable picks. Goods-to-person systems cut pick times by 60-70%.
Our work with Decathlon — deploying 1,000+ robots across 25+ projects — shows how retail-scale automation compounds returns across multiple facilities.
Manufacturing
- Payback period: 2.5-4 years
- Primary ROI driver: 24/7 unmanned operation, WIP buffer management
- Typical ROI at 5 years: 200-300%
- Key factor: Consistent, predictable throughput. YKK's deployment achieved fully unmanned 24/7 operation with goods-to-person picking and robotic arm integration.
Third-Party Logistics (3PL)
- Payback period: 2-3 years
- Primary ROI driver: Multi-client flexibility, SLA compliance
- Typical ROI at 5 years: 200-350%
- Key factor: Ability to handle variable client requirements without proportional labor scaling. A flexible WES platform is critical here.
Cold Chain and Pharmaceutical
- Payback period: 1.5-2.5 years
- Primary ROI driver: Reduced human exposure to harsh environments, compliance
- Typical ROI at 5 years: 300-450%
- Key factor: Labor costs in cold storage are 20-40% higher than ambient. Automation ROI is amplified because you are replacing more expensive labor. Regulatory compliance tracking adds further value.
Hidden Costs That Can Kill Your Warehouse Automation ROI
After working on 50+ integration projects, we have seen the same ROI killers come up repeatedly. Watch for these:
1. Integration Complexity
The automation hardware is rarely the problem. The pain point is connecting it to your existing WMS, ERP, and order management systems. Budget 15-20% of total project cost for integration work. If your vendor quotes less than 10%, they are either cutting corners or planning change orders.
This is exactly why a strong WES (Warehouse Execution System) matters. The WES sits between your WMS and the physical automation, translating business logic into robot commands. A well-architected WES — like the one we deploy with microservice architecture and multi-vendor device support — reduces integration risk significantly.
2. Underestimating Site Preparation
Floor flatness requirements for AGVs and mobile robots are strict (typically FF50+ or 3mm deviation per 3m). Older warehouses often need floor grinding or leveling. Electrical upgrades for charging stations, network infrastructure for real-time communication, and fire suppression modifications can add $100K-$500K that was not in the original quote.
3. Change Management and Training
The technology works. The people side is harder. Plan for 3-6 months of parallel operation (manual + automated), dedicated training programs for operators, maintenance staff, and supervisors, process redesign since automated workflows are fundamentally different from manual ones, and resistance management since some experienced staff will push back.
4. Throughput Mismatch
Sizing the system for average throughput instead of peak throughput is a common and expensive mistake. If your system handles 800 orders/hour but Black Friday demands 1,400, you are back to manual overflow processes that erode ROI.
Design for 120-130% of projected peak, not average. The marginal cost of extra capacity during installation is far less than retrofitting later.
5. Vendor Lock-in
Single-vendor solutions can look cheaper upfront but create long-term cost traps. Proprietary software, non-standard interfaces, and exclusive maintenance contracts limit your options for expansion and optimization.
As an integrator working with multiple equipment vendors, we have seen clients save 15-25% on Phase 2 expansions by keeping their options open from the start. Multi-vendor compatibility is not just a technical preference — it is an ROI strategy.
How to Build Your Warehouse Automation ROI Model
Ready to run the numbers for your operation? Here is a step-by-step framework:
Step 1: Baseline your current costs. Document every cost category: labor (by function), space (lease or ownership), error rates, inventory carrying costs, energy, equipment maintenance.
Step 2: Define the automation scope. Which processes will be automated? Picking only? Putaway + picking? Full inbound-to-outbound? The scope determines both cost and benefit.
Step 3: Get real quotes. Request detailed proposals from at least 2-3 vendors or integrators. Compare not just hardware costs but integration scope, software licensing models, and maintenance terms.
Step 4: Model conservatively. Use 70% of projected benefits for Year 1 (ramp-up), 90% for Year 2, and 100% from Year 3 onward. Add a 15% contingency to CAPEX for unexpected costs.
Step 5: Run sensitivity analysis. What happens if labor costs rise 5% annually? What if throughput grows 20% faster than projected? What if the project takes 3 months longer to commission? Test your model against realistic scenarios.
Step 6: Calculate NPV, not just simple ROI. A dollar saved in Year 5 is worth less than a dollar saved in Year 1. Use a discount rate of 8-12% (your company's cost of capital) to calculate Net Present Value. This gives a more accurate picture than simple payback period.
According to the Material Handling Institute (MHI), 83% of supply chain leaders believe automation will be a competitive differentiator within the next five years. The question is not whether to automate, but how to do it in a way that maximizes return.
Frequently Asked Questions
What is a good ROI for warehouse automation?
A well-planned warehouse automation project should target 200-300% ROI over 5 years, with a payback period of 2-4 years. Projects with payback periods longer than 5 years typically indicate either oversized investment relative to the operation or underutilization of the system. The strongest ROI cases involve high-volume operations with significant labor costs and multi-shift requirements.
How much does warehouse automation cost per square foot?
Costs range from $50-$150 per square foot for light automation (conveyor systems, pick-to-light) to $200-$500+ per square foot for dense ASRS installations. The per-square-foot metric can be misleading because automation increases storage density — you may automate 30,000 sq ft but gain the equivalent capacity of 80,000 sq ft of manual storage. A better metric is cost per storage position or cost per order picked.
Does warehouse automation reduce labor costs?
Yes, typically by 50-75% in the automated zones. A manual warehouse spending $2-4 million annually on labor can expect to reduce that to $600K-$1.5M after full automation deployment. The remaining labor shifts from repetitive physical tasks to system monitoring, exception handling, and maintenance — roles that are easier to fill and retain.
What is the payback period for an ASRS system?
Most ASRS systems pay for themselves in 2-4 years. Smaller goods-to-person deployments ($500K-$2M) often hit payback in 18-24 months due to lower upfront cost and immediate labor impact. Large-scale crane-based systems ($5M-$20M+) typically take 3-5 years but deliver higher absolute returns over their 15-20 year equipment lifecycle. Read our complete ASRS cost breakdown for detailed pricing by system type.
How do I justify warehouse automation to leadership?
Build the business case around three pillars: (1) quantified labor savings with current and projected wage growth, (2) capacity expansion without new real estate, and (3) competitive necessity — your competitors are automating, and falling behind on fulfillment speed and accuracy will cost market share. Present a 5-year NPV model, not just a simple ROI percentage. Include risk factors like labor market tightness and lease cost escalation to show what happens if you do not automate.
Can small warehouses benefit from automation?
Yes, but the approach differs. Warehouses under 20,000 sq ft should look at modular solutions — vertical lift modules (VLMs), autonomous mobile robots (AMRs), or small-scale goods-to-person systems — rather than full ASRS installations. These entry-level solutions cost $100K-$500K and can deliver payback in 12-18 months. The key is matching the automation type to your specific bottleneck rather than over-investing in capacity you do not need.
Next Steps
Calculating warehouse automation ROI is not a spreadsheet exercise you do once. It is an ongoing process that starts with understanding your current operation and ends with a phased implementation plan that manages risk while capturing returns.
If you are evaluating automation for your warehouse, we can help you build a detailed ROI model based on your actual operational data — not generic industry averages. Get in touch with our team to start the conversation.
Planning a Warehouse Automation Project?
Our team has delivered 50+ ASRS systems across retail, manufacturing, and logistics. Tell us about your project and we will get back to you within 24 hours.
Thank you!
We received your message and will get back to you within 24 hours.